
Building healthy relationships and meaningful interactions with those around us is essential for social well-being. These interactions with our friends, family, and colleagues might occur in person, over mobile phones, or through social media platforms like Facebook or WhatsApp. The purpose of this article is to comprehend social well-being using mobile phones. This is conceivable because when we use mobile phones, we leave a trail of information that can be utilized to investigate our social behavior. This article dives into three areas of social well-being that have been addressed using mobile data. The first study developed a pandemic model that incorporates people’s mobility and social contact. The following study examines societal segregation utilizing call data records (CDR) with users’ demographic information, such as gender, age, and language. Following that, we predicted socioeconomic conditions (SEC) using digital data from mobile apps (such as WhatsApp and YouTube).
The role of people’s mobility and social connectivity in the spread of disease.
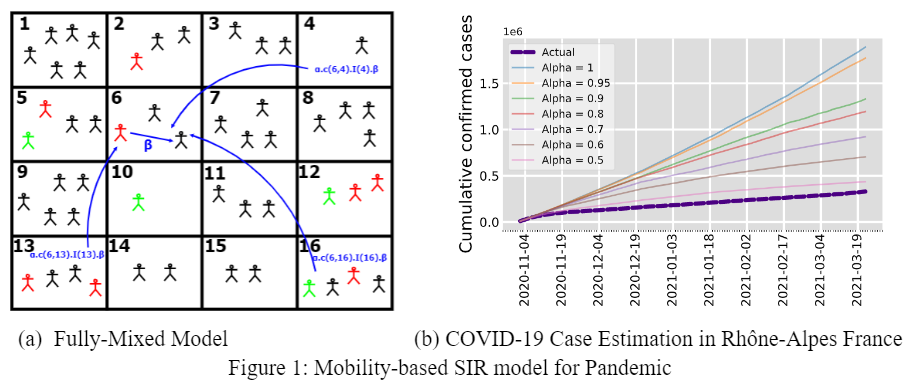
The SIR model is one of the widely used models to understand the spread of disease. This model divides a population into three compartments (Susceptible, Infected, and Recovered). Susceptible refers to the population that has not yet been infected. The Infected population has the disease and the Recovered population had previously been infected but is now immune to it. However, to name a few limitations of the SIR model, it does not consider people’s mobility and social connectivity during spread of a disease. In our first contribution, we overcome these limitations, and proposed an extension of the SIR model. In our proposed model, we show the effects of the population’s mobility and social connectivity (which we capture using CDR data) on the spread of disease (Figure 1a). From the analysis, we find that restricting mobility from top-10 percentile highly connected locations can reduce infection spread by 18% to 27%. Further, we showed our model can be used to estimate COVID-19 cases by taking the example of Estonia and the Rhône-Alpes region in France (Figure 1b). For more detail, read our article Mobility based SIR model for pandemics and complex networks.
Understanding Segregation in Society from CDR.
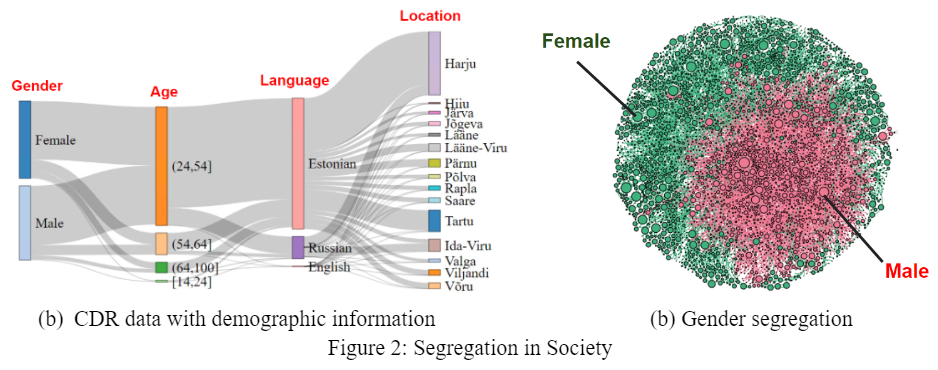
Segregation is defined as the degree of separation between two or more population groups. Over the decades, the research community has paid attention to segregation studies. However, most earlier research has relied on Census data, which can capture the exact pattern of physical settlement but rarely records patterns of social interaction, which are essential to develop a thorough picture of social interaction dynamics. In our second contribution, we utilized CDR data that captures social interaction to study segregation in society.Our dataset covers the whole country of Estonia and includes users’ gender, age, and language information. Figure 2a presents the CDR data based on demographics. Figure 2b shows cluster formation among males and females. Our in depth analysis shows the presence of segregation among males and females. Comparing the CDR with census data, we showed that CDR data could be an alternative source to study segregation. For more detail, read our articles on gender segregation and demographic segregation.
Predicting Socio-economic conditions (SEC) using mobile data.
A country’s Socio-economic conditions (SEC) provide context for assessing its overall growth. These SEC indicators contain information about education, gender, poverty, employment, and other factors. Therefore, reliable and accurate information is critical for social research and government policing. Most data sources available today, such as censuses, which have sparse population coverage and are updated infrequently. In this work, we utilized mobile app consumption data to show that it can serve as cost-effective and up-to-date source for identifying SEC.
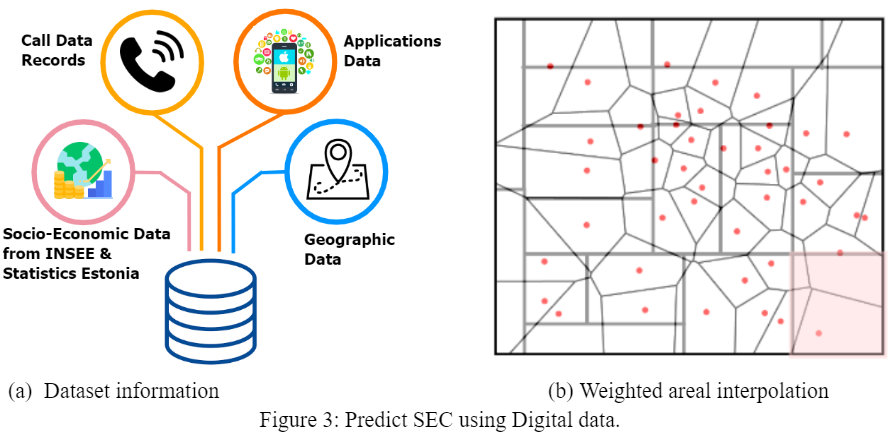
There are multiple big datasets utilized in this work that contain mobile application consumption, geospatial data, and SEC information (all from France), as shown in Figure 3a. As mobile application consumption data is available at the base station level, we used the weighted areal interpolation method to transform base station-level information to the granularity of IRIS, as shown in Figure 3b. In France, IRIS is a region used to divide the country into units of similar population size. We also proposed Typical Week Signature (TWS) to predict the SEC, as TWS is capable of capturing the user’s behavioral patterns over the entire week. We found that mobile app consumption can be used to predict SEC, and our proposed TWS has richer information diversification. For more detail, read our article here.
The presented thesis offers significant advancements in the field of CDR data analysis for social well-being. The study sheds light on understanding users’ behavior from CDR data. In particular, their mobility patterns, social interaction, and mobile application consumption patterns. These differences in the usage pattern can be used to develop a more sophisticated pandemic model, study segregation in society, and predict socio-economic conditions. Additionally, in all our work, we take the utmost care about user privacy. Our research is valuable to the scientific community as it stems from its ability to improve knowledge and stimulate more investigation in this domain.